Key messages
Biological oxygen demand (BOD) and ammonium concentration have increased in
Armenian rivers below settlements over the period 2010-2021. The main sources of BOD and ammonium pollution
are discharge of non-treated or not sufficiently treated household wastewater, which due to the lack of
treatment plants is directly emitted to the rivers, and agriculture runoff.
The BOD and ammonium
concentration are more or less stable at river sites above settlements.
The average ammonium
concentration increased by 64% (from 1.4 to 2.3 mg N/l) from 2008 to 2021 at river sites below
settlements.
The average BOD increased by 22% (from 3.2 to 3.9 mg O2/l) from 2008 to 2021 at river
sites below settlements.
The largest proportion of sites with relatively elevated ammonium
concentrations in 2021 are found in the Hrazdan and Akhuryan river basins (WTP)
Sites with relatively
elevated BOD levels in 2021 are mainly found in the Southern and Hrazdan river basins (WTP).
Is organic matter and ammonium pollution in rivers in the Republic of Armenia decreasing?
Figure 1 - Rivers – Annual mean biological oxygen demand - BOD (2007-2024)
Rivers-BOD5
Rivers-BOD5 (without 55)
Data sources:
Data was provided by the Ministry of Environment of the Republic of Armenia under the ENI SEIS II East project activities
(C10, C11) Water quality indicator, by observation points and years provided by ArmStatBank
Note: The data series are calculated as the average of annual mean BOD (mg O2/l) for river sites in Armenia for the period 2007-2021. The number of river sites is 45 (21 sites above settlements and 24 sites below), representing 22 rivers. The right hand plots show the average time series without the site 55.
Figure 2 - Rivers - mean ammonium concentration (2007-2024)
Rivers-Ammonium
Rivers-Ammonium (without 55)
Data sources:
Data was provided by the Ministry of Environment of the Republic of Armenia under the ENI SEIS II East project activities
(C10, C11) Water quality indicator, by observation points and years provided by ArmStatBank
Note:The data series are calculated as the average of annual mean ammonium concentration (NH4-N/l) for river sites in Armenia for the period 2007-2021. The number of river sites is 45 (21 sites above settlements and 24 sites below), representing 22 rivers. The right hand plots show the average time series without the site 55.
Figure 3 - Rivers – BOD and Ammonium (2024), using the national classification system
Rivers-BOD5 2024
Rivers-Ammonium 2024
Data sources:
Data was provided by the Ministry of Environment of the Republic of Armenia under the ENI SEIS II East project activities
(C10, C11) Water quality indicator, by observation points and years provided by ArmStatBank
Note: Distribution of river monitoring sites to BOD (left) and ammonium (right) water quality classes in the different river basins (Akhuryan, Ararat, Hrazdan, Northern, Sevan, Southern) of the Republic of Armenia, based on annual average concentrations for 2021. The number of monitoring sites per river basin is given in parenthesis. The national class system is used. See the “National target” section of the indicator specification for detailed information on the applied national classes.
BOD5 and ammonium are the main indicators for the characterization of organic water pollution.
BOD5 shows how much dissolved oxygen is used to break down organic matter in the water.
Concentrations of these indicators usually increase as a result of the absence of wastewater
treatment plants, organic pollution of industrial and agricultural runoff. Organic pollution can
lead to deoxidation of river water, increase in ammonium concentration, and extinction of fish
and invertebrates. The main source of organic matter in Armenia is wastewater (untreated or
insufficiently treated), which is discharged directly into rivers due to the lack of treatment
plants.
2010-2021 Average concentrations of BOD5 and ammonium increased at observation
sites downstream of settlements due to untreated domestic wastewater and agricultural runoff.
2010-2021 in observation points located below settlements, the average concentration of BOD5
increased by 53%, and the concentration of ammonium increased by more than 2 times. Average
concentrations of BOD5 and ammonium are relatively more stable at observation points above
settlements. This means that in less populated areas, there is less municipal wastewater.
Involved in all 45 observation points in 2010-2021. growth is slightly lower than at observation
points below settlements.
Hrazdan River is one of the longest and most polluted rivers in Armenia. The effect of the lack of a sewage treatment plant is especially noticeable at observation point 55, which is the first observation point after the city of Yerevan (the capital of Armenia, about 1 million people) and characterizes the communal-domestic impact of the city on the river. This fact has a large effect on the averaged time series, especially for ammonium. In 2021, the average ammonium concentration at observation points downstream of settlements is more than 2 times higher when observation point 55 is included. The difference between the averaged results with and without observation point 55 increases over time. For BOD5 the difference is smaller, but again there is a time-dependent increasing trend, which means that BOD5 increases more at observation point 55 than at the other observation points.
|
|
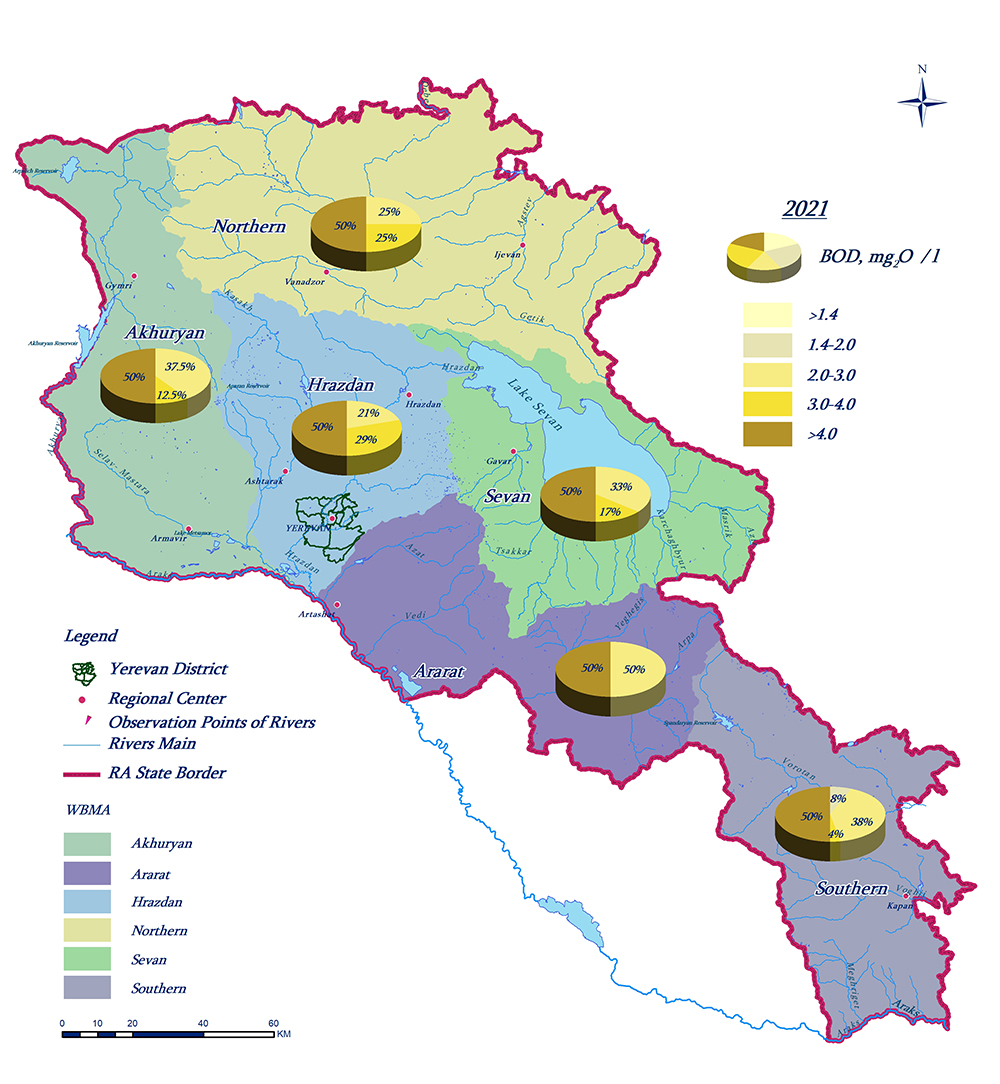
Figure 4 - Rivers – BOD5 (2021) |
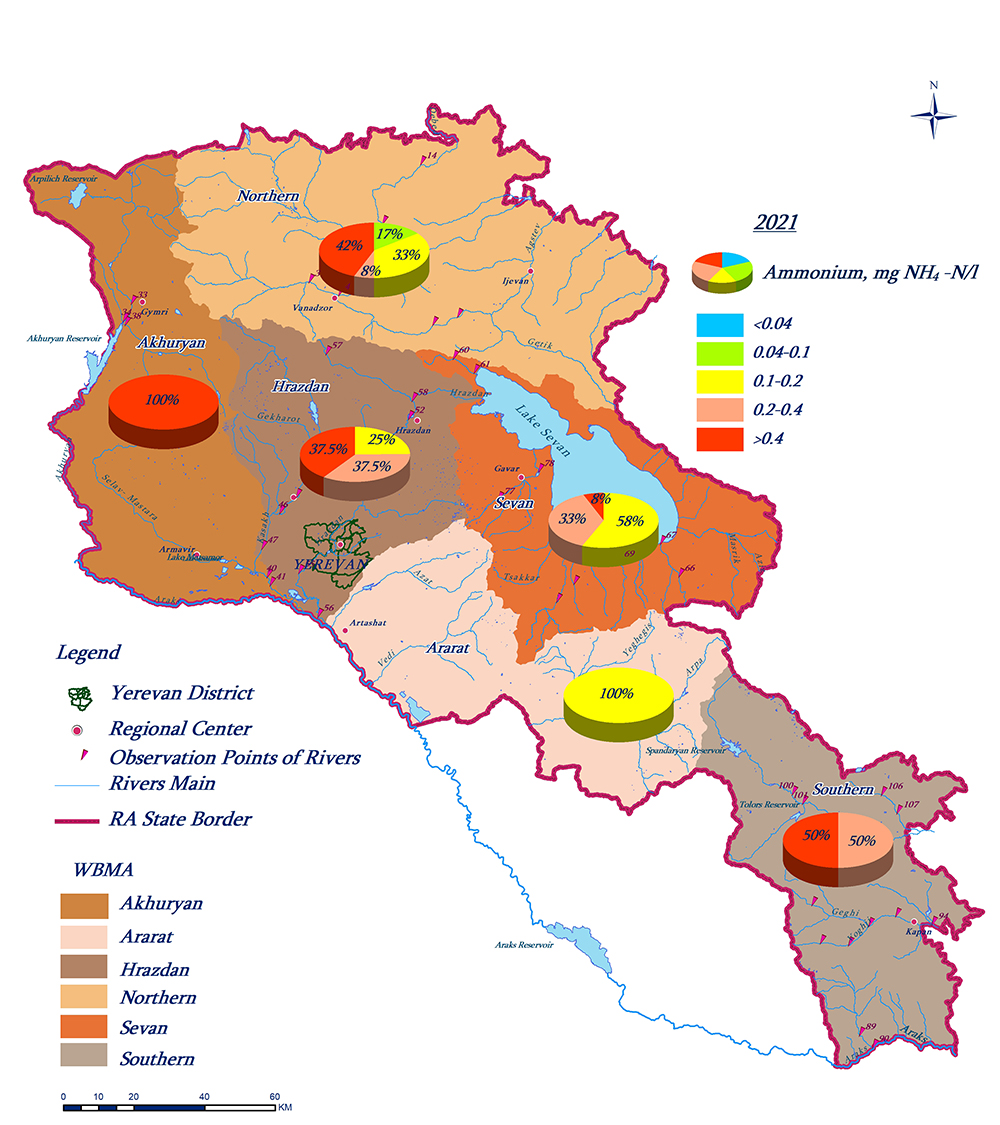
Figure 5 - Rivers – Ammonium (2021) |
Data sources:
The maps was provided by the "Hydrometeorology and Monitoring Center" SNCO of the Ministry of Environment.
Note: Distribution of river monitoring observation points according to water quality classes with BOD5 (left) and ammonium (right) in 6 water basin management areas of the Republic of Armenia (Akhuryan, Araratyan, Hrazdan, Northern, Sevan, Southern) based on the annual average concentrations of 2021. In parentheses are the number of monitoring observation points in the respective WTP. A national assessment system was applied. For information on the relevant national norms, see the indicator profile in the "National Target" section.
The class system is the same as the one used in the EEA indicator WAT 002- Oxygen consuming substances European rivers. See the indicator specification section there for further information.
Note: Distribution of river monitoring observation points according to ammonium concentration classes in 6 water basin management areas of the Republic of Armenia (Akhuryan, Araratyan, Hrazdan, Northern, Sevan, Southern), based on the annual average concentrations of 2021.
In 2021, the mean BOD5 for observation points below settlements is 64% higher
than for observation points above settlements, which in particular reflects the discharge of
untreated wastewater. The difference is much larger for ammonium, where in 2021 the average
values for sites below settlements are 5 times higher than the average values for sites above
settlements (and a corresponding 9 times higher, including site 55).
In 2021, the water
quality at observation points N38 of the Karkachun River of the Akhuryan WTP and N344 of the
Karchevan River of the Southern WTP, according to the national water quality norms, was assessed
as "bad" due to the high concentration of BOD5 and other indicators.
According to the
average ammonium concentrations in 2021, monitoring sites below settlements are mostly of
"inadequate" or "poor" quality. High concentrations of ammonium were observed in most
observation points of Hrazdan WTP, N4 of Pambak River in Northern WTP, N38 of Karkachun River in
Akhuryan WTP, N344 of Karchevan River in South WTP and N107 of Vararak River, where the water
quality was assessed as "poor". due to other indicators as well.
In general, the highest
concentration of BOD5 and ammonium in 2021 is observed in the Hrazdan River at the observation
point downstream of Yerevan city (observation point 55). The Hrazdan River Basin is the most
populated river basin in Armenia, dominated by observation points with "poor" water quality and
especially ammonium pollution.
Indicator definition
C-10 indicator - Biochemical oxygen demand (BOD5) and ammonium concentration in rivers
- The level of oxygen concentration in water bodies, expressed as biochemical oxygen demand (BOD), which is the amount of dissolved oxygen required for the aerobic decomposition of organic matter present in water - and the level of concentrations of ammonium (NH4/N-NH4) in rivers.
Units
The annual average BOD after five days of incubation (BOD5) at 20 degrees Celsius is expressed in mg of O2/litre; the ammonium concentration is expressed in mg of N/litre.
Rationale
Justification for indicator selection
Large quantities of organic matter (microbes and decaying organic waste) can result in reduced chemical and biological quality of river water, impaired biodiversity of aquatic communities, and microbiological contamination that can affect the quality of drinking and bathing water. Sources of organic matter are discharges from wastewater, industrial effluents and agricultural runoff. Organic pollution leads to higher rates of metabolic processes that demand oxygen. This could result in the development of water zones without oxygen (anaerobic conditions). The transformation of nitrogen to reduced forms under anaerobic conditions, in turn, leads to increased concentrations of ammonium, which is toxic to aquatic life above certain concentrations, depending on water temperature, salinity and pH.
Scientific references
- Council Directive 91/271/EEC of 21 May 1991 concerning urban wastewater treatment
- Directive 2000/60/EC of the European Parliament and the Council of 23 October 2000 establishing a framework for Community action in the field of water policy
- Water Framework Directive
- UNECE, 2018. Guidelines for the Application of Environmental Indicators, Description of C10. Biochemical oxygen (BOD) and concentration of ammonium in rivers.
- UNECE, 2018. Guidelines for the Application of Environmental Indicators, Glossary of terms – C10. Biochemical oxygen demand (BOD) and concentration of ammonium in river
Context description
National policy context
This Code regulates water relations in the field of use, protection and development of water resources for guaranteed, adequate and safe supply of water for the population, protection of the environment and promotion of the rational development of the water fund of the country.
Requires “on establishing the norms for assuring water quality of each Water Basin Management District, depending upon local peculiarities”.
International policy context
The UNECE-WHO/Europe Protocol on Water and Health aims to protect human health by better water management and by reducing water-related diseases. The Protocol provides a framework to translate into practice the human rights to water and sanitation and to implement SDG 6. Armenia has signed the Water and Health Protocol in 1999, however, ratification is under the process and not finalized yet.
Targets
National targets
The norms for some parameters according to Government Decision №75-N:
| Parameter | Water Classes | ||||
| I (high) | II (good) | III (moderate) | IV (poor) | V (bad) | |
| Ammonium (mg NH4-N/l) | <0.2 | 0.2-0.4 | 0.4-1.2 | 1.2-2.4 | >2.4 |
| BOD (mg O2/l) | <3.0 | 3.0-5.0 | 5.0-9.0 | 9.0-18 | >18 |
International targets
The UN Sustainable Development Goal 6 target 6.3 aims to achieve, by 2030, improve water quality by reducing pollution, eliminating dumping and minimizing release of hazardous chemicals and materials, halving the proportion of untreated wastewater and substantially increasing recycling and safe reuse globally.
Related policy documents
Methodology for indicator calculation
The monitoring programme for BOD5 and ammonium concentrations in rivers is
structured to take into account the spatial and temporal dynamics of the indicators. The
monitoring sites are located both before and after settlements, which provides information both
on background concentrations and the influence of the settlements. The number of rivers sites is
45 (21 sites above settlements and 23 below), representing 22 rivers. The monitoring frequency
is 7-12 per year, covering all hydrological phases.
The chemical analyses are carried out
at the Laboratory of Environmental Monitoring and Information Center of the Ministry of
Environment of the Republic of Armenia.
Annual time series for each site are calculated by
averaging the values for individual samples per year. Aggregated time series are calculated as
the average of the individual annual time series. For rivers separate aggregations are made for
river sites above and below settlements.
Methodology for gap filling
For time series and trend analyses, only series that are complete (i.e. no missing values in the site data series) are used. This is to ensure that the aggregated data series are consistent, i.e. including the same sites throughout the time series. In this way assessments are based on actual changes in concentration, and not changes in the number of sites. Hence, no gap filling has been applied.
Methodology references
- EEA, 2005. EEA core set of indicators guide. EEA Technical report No 1/2005, ISBN 92-9167-757-4, Luxembourg.
- ISO 7150-1:1984 Water quality — Determination of ammonium — Part 1: Manual spectrometric method. The procedure is applicable to the analysis of potable water, and most raw and waste waters. Application to excessively coloured or saline waters shall be preceded by distillation.
- ISO 5815-2: 2003 Environmental protection and environmental management. Analytical control and monitoring. Water quality. Determination of biochemical oxygen consumption after n days (BODn). Part 2. Method without diluting samples.
- UNECE, 2018. Guidelines for the Application of Environmental Indicators, Description of C10. Biochemical oxygen demand (BOD) and concentration of ammonium in rivers.
- UNECE, 2018. Guidelines for the Application of Environmental Indicators, Glossary of terms – C10. Biochemical oxygen demand (BOD) and concentration of ammonium in rivers.
- UNSD and UNEP, 2013. Questionnaire 2013 on Environment Statistics. United Nations Statistics Division and United Nations Environment Programme, Questionnaire 2013 on Environment Statistics, Section Water.
Methodology uncertainty
No methodological uncertainty has been specified.
Data sets uncertainty
No uncertainty has been specified.
Rationale uncertainty
Biochemical oxygen demand and total ammonium are well suited for illustrating water pollution with oxygen consumption. However, using annual average values may not fully illustrate the severity of low oxygen conditions.
- ArmStatBank - Annual mean BOD and ammonium concentration values for most monitoring sites are published at ARMSTAT
- Environmental Monitoring and Information Center SNCO - Data on BOD5 and ammonium concentration in surface waters are available for several decades (since 1977) and are stored in the national database: Water Base - Environmental Monitoring and Information Center SNCO, Ministry of Nature Protection Republic of Armenia
- Water Quality report 2021. The classification of the river monitoring sites based on BOD5 and ammonium concentration (according to national water quality norms) are published in monthly and annual surface water quality reports by the "Hydrometeorology and Monitoring Center" SNOC of the Ministry of Environment.
| Indicator Set UNECE regional environmental indicators-C10 and European Environment Agency Core Set of Indicators – CSI 019 |
Date: 13.02.2023 Authors: Shahnazaryan Gayane Zatikyan Anna |
Indicator Title
C10- BOD and concentration of ammonium in rivers