Key messages
The nutrient concentrations have increased in Armenian rivers below settlements over the period 2010 to 2021
due to emissions of untreated domestic wastewater from settlements and diffuse runoff from agriculture. The
main sources of nutrients are agriculture, wastewater, and storm water. When nutrients are not fully
utilized by plants, they can be lost from the farm fields and negatively impact downstream water quality.
Average nutrient concentrations are more or less stable at river sites above settlements.
The average
phosphate concentration increased by 57% (from 0.14 to 0.22 mg P/l) from 2010 to 2021 at river sites below
settlements.
The average concentration of nitrates in observation points below settlements in
2010-2016. increased by 31% (2.06-2.69 mgN/L), then decreased to 1.54 mgN/L in 2021.
The current (2021)
river concentration levels are poorest for sites in the Hrazdan and Akhuryan river basins. In general, the
situation is worse for phosphate than for nitrate concentration and worse for below thanove settlements.
Are concentrations of nutrients in surface water of the Republic of Armenia decreasing?
Figure 1 - Nutrients in surface waters (2008-2024)
Rivers-Phosphate
Rivers-Phosphate (without 55)
Rivers-Nitrate
Rivers-Nitrate (without 55)
Data sources:
Data was provided by the Ministry of Environment of the Republic of Armenia under the ENI SEIS II East project activities.
Note: The data series are calculated as the average of annual mean concentrations for river and lake monitoring sites in Armenia for the period 2007-2021. The number of river sites is 45 (21 sites above settlements and 24 below), representing 22 rivers. The right hand river plots show the average time series without the site 55.
Figure 2 - Rivers – phosphate and nitrate (2022), using the national classification system
Rivers-PO4 2024
Rivers-NO3 2024
Data sources:
Data was provided by the Ministry of Environment of the Republic of Armenia under the ENI SEIS II East project activities
(C10, C11) Water quality indicator, by observation points and years provided by ArmStatBank
Note:
Distribution of river monitoring sites to phosphate (left) and nitrate (right) water quality classes in the different river basins (Akhuryan, Ararat, Hrazdan, Northern, Sevan, Southern) of the Republic of Armenia, based on annual average concentrations for 2021. The number of monitoring sites per river basin is given in parenthesis. The national class system is used. See the “National target” section of the indicator specification for detailed information on the applied national classes.
Large inputs of nutrients to freshwater from urban and agricultural point and non-point sources
can lead to ecological changes, eutrophication of water and have negative impacts on the use of
water for human consumption and other purposes. The main source of nutrients in Armenia is
agriculture, wastewater and storm water. There are only six treatment plants in Armenia, with
mechanical treatment only. Nitrate pollution is mainly associated with agriculture.
Between
2010 and 2016, the average concentration of nitrates in river monitoring stations downstream of
settlements increased by 31%. This is due to increased wastewater and agricultural runoff. In
the same period, an increase in nitrate concentration by 11% was observed in observation points
above the settlements. 2010-2021 During the period, the average concentration of phosphate at
observation points downstream of settlements increased by 60%. The average concentration of
phosphate in the observation points above the settlements increased by 27%.
The Hrazdan
river is one of the longest and most polluted rivers in Armenia and the closest after Yerevan
city, the concentration of phosphate is very high at observation point 55. Excluding this site,
phosphate concentrations at sites downstream of settlements decrease by 16-24% between 2010 and
2021, respectively, and therefore mean concentrations at all sites also decrease. No such effect
is observed for nitrates, indicating that wastewater is the main discharge source at this
observation site.
 |
 |
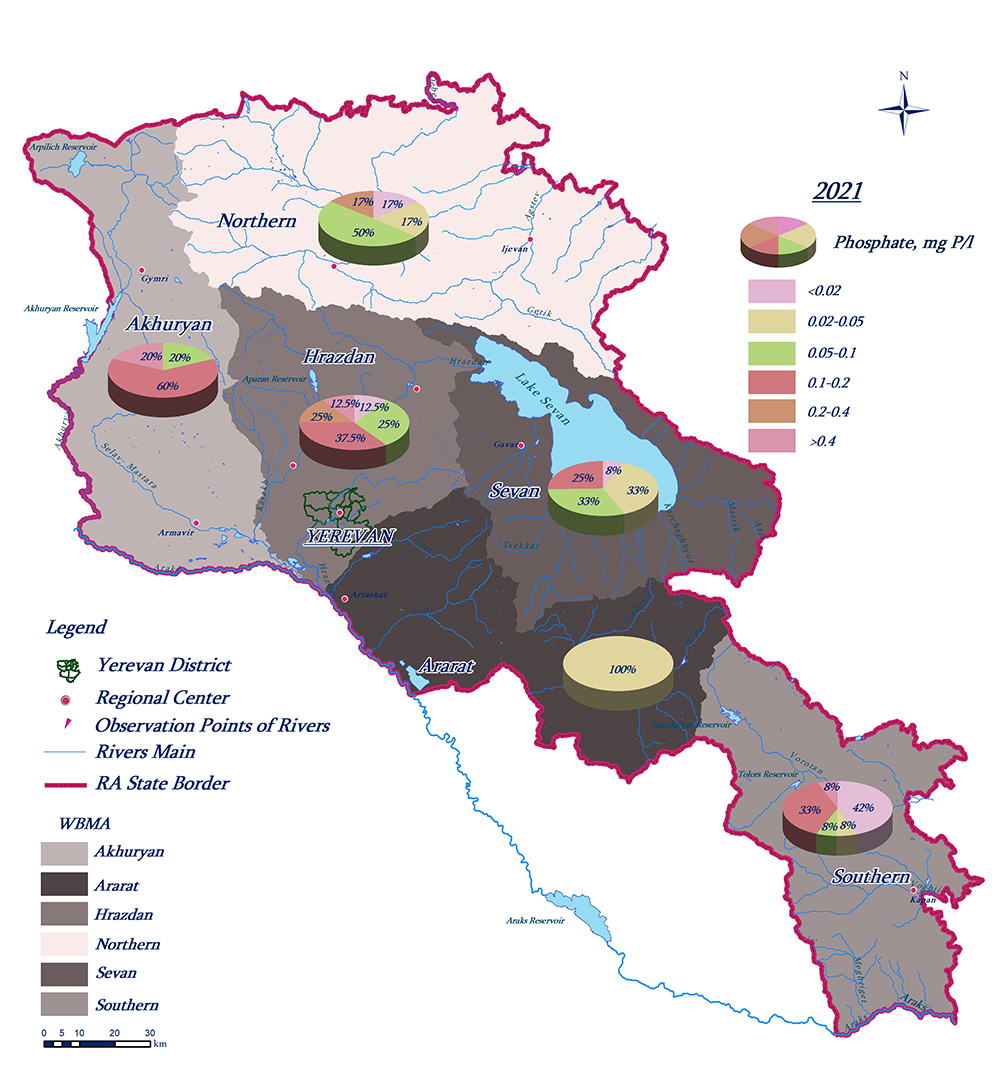
Figure 3 - Rivers – Phosphate (2021) |
Figure 4- Rivers – Nitrate (2021) |
Data sources:
The maps was provided by the "Hydrometeorology and Monitoring Center" SNCO of the Ministry of Environment.
Note: Distribution of river monitoring sites to phosphate concentration classes in the different river basins (Akhuryan, Ararat, Hrazdan, Northern, Sevan, Southern) of the Republic of Armenia, based on annual average concentrations for 2021. The class system is the same as the one used in the EEA indicator WAT 003 Nutrients in freshwater in Europe. See the indicator specification section there for further information.
Note: Distribution of river monitoring sites to nitrate concentration classes in the different river basins (Akhuryan, Ararat, Hrazdan, Northern, Sevan, Southern) of the Republic of Armenia, based on annual average concentrations for 2021. See the indicator specification section there for further information.
Nutrient concentrations are generally higher below than above settlements, due to emissions of wastewater and other human activities. On average, average phosphate concentration for monitoring sites below settlements were 3.3 times higher than the average concentration for sites above settlements in 2017.
The Hrazdan and Southern river basins are the only ones with sites in bad quality for phosphate (13% and 8%, respectively) in 2017. The Akhuryan (100%) and Hrazdan (88%) river basins had the highest proportion of sites with less than good quality.
For nitrate there were no rivers in bad quality in 2021, but 13% of the river sites in the Hrazdan river basin had poor quality. The highest share of sites with less than good quality was found in the Akhuryan (40%), Northern (33%) and Hrazdan (25%) river basins. The Southern river basin had no river sites in less than good quality and a high proportion of sites in high quality (83)*.
Overall the highest phosphate concentration in 2021 was observed at the river site below Yerevan City in Hrazdan river basin (monitoring site 55). The Hrazdan river basin is the most populated river basin in Armenia and had a high proportion of sites with high nutrient concentrations, especially phosphate. The other river basin with a high proportion of sites with elevated nutrients concentration was Akhuryan, where the second populated city (Gyumri) is located. The wastewaters of both cities discharge directly into the rivers due to lack of wastewater treatment plants.
Indicator definition
Concentrations of phosphate and nitrate in rivers and total phosphorus and nitrates in lakes.
Units
The concentration of phosphate and total phosphorus is expressed as mg of P/litre the concentration of nitrate is expressed as mg of NO3-N/litre.
Rationale
Justification for indicator selection
Large inputs of nitrogen and phosphorus to water bodies from urban areas, industry and agricultural areas can cause ecological changes that can result in a loss of plant and animal species (reduction in ecological status) and have negative impacts on the use of water for human consumption and other purposes.
Scientific references
- Urban Waste Water Directive - Environment
- Directive
2000/60/EC of the European Parliament and of the Council establishing a framework for
Community action in the field of water policy
UNECE, 2018. Guidelines for the Application of Environmental Indicators, Description of C11. Nutrients in freshwater.
UNECE, 2018. Guidelines for the Application of Environmental Indicators, Glossary of terms – Description of C11. Nutrients in freshwater.
Context description
National policy context
- Republic of Armenia Water Code
(adopted on June 4, 2002)
This Code regulates water relations in the field of use, protection, and development of water resources for guaranteed, adequate and safe supply of water for the population, protection of the environment and promotion of the rational development of the water fund of the country.
Requires “on establishing the norms for assuring water quality of each Water Basin Management District, depending upon local peculiarities.”
International policy context
The UNECE-WHO/Europe Protocol on Water and Health aims to protect human health by better water management and by reducing water-related diseases. The Protocol provides a framework to translate into practice the human rights to water and sanitation and to implement SDG 6.
Targets
National targets
The norms for some parameters according to Government Decision №75-N:
| Parameter | Water Classes | ||||
| I (high) | II (good) | III (moderate) | IV (poor) | V (bad) | |
| Nitrate (mg NO3-N/l) | <1 | 1-2.5 | 2.5-5.6 | 5.6-11.3 | >11.3 |
| Phosphate (mg P/l) | <0.05 | 0.05-0.1 | 0.1-0.2 | 0.2-0.4 | >0.4 |
International targets
The UN Sustainable Development Goal 6 target 6.3 aims to achieve, by 2030, improve water quality by reducing pollution, eliminating dumping, and minimizing release of hazardous chemicals and materials, halving the proportion of untreated wastewater and substantially increasing recycling and safe reuse globally.
Related policy documents
Methodology for indicator calculation
The monitoring programme for nitrate and phosphate concentrations in rivers is structured to consider the spatial and temporal dynamics of the indicators. The monitoring sites are located both before and after settlements, which provides information both on background concentrations and the influence of the settlements. The number of rivers sites is 45 (21 sites above settlements and 23 below), representing 21 rivers. The monitoring frequency is 7-12 per year, covering all hydrological phases. The chemical analyses are carried out at the Laboratory of the Environmental Monitoring and Information Center of the Ministry of Nature Protection of the Republic of Armenia.
Annual time series for each site are calculated by averaging the values for individual samples per year. Aggregated time series are calculated as the average of the individual annual time series. For rivers separate aggregations are made for river sites above and below settlements.
Methodology for gap filling
For time series and trend analyses, only series that are complete (i.e., no missing values in the site data series) are used. This is to ensure that the aggregated data series are consistent, i.e., including the same sites throughout the time series. In this way assessments are based on actual changes in concentration, and not changes in the number of sites. No gap filling has been applied for the river sites, but for some of the lake sites missing data in 2013-14 were gap filled by linear interpolation.
Methodology references
- ISO 6878:2004- Water quality — Determination of phosphorus — Ammonium molybdate spectrometric method.
- ISO 7890-3:1988— Determination of nitrate — Part 3: Spectrometric method using sulfosalicylic acid.
- EEA, 2005. EEA core set of indicators guide.
- UNECE, 2018. Guidelines for the Application of Environmental Indicators, Glossary of terms – C11. Nutrients in freshwater.
- UNSD/UNEP Questionnaire on Environment Statistics.
Methodology uncertainty
No methodological uncertainty has been specified.
Data sets uncertainty
No uncertainty has been specified.
Rationale uncertainty
No uncertainty has been specified.
- ArmStatBank publishes average annual nitrate and phosphate concentration values for most
observations."Hydrometeorology and Monitoring Center" SNCO - Data on the concentration of
biogenic substances in surface water are available for several decades (since 1977) and are
stored in the national database. Water base - RA Ministry of Environment, "Hydrometeorology
and Monitoring Center" SNCO.
Water Quality report 2018. The classification of the river monitoring sites based on nitrate and phosphate concentrations (according to national water quality norms) are published in monthly and annual surface water quality reports by the “Hydrometeorology and Monitoring Center” SNCO of the Ministry of Environment of the Republic of Armenia.
| Indicator Set UNECE regional environmental indicators- C11(See also European Environment Agency Core Set of Indicators – CSI 020) |
Date: 23.10.2022 Authors: Shahnazaryan Gayane Zatikyan Anna |
Indicator Title
C11- Nutrients in freshwater